| (%i1) | load(draw)$ |
| (%i2) | load(eigen)$ |
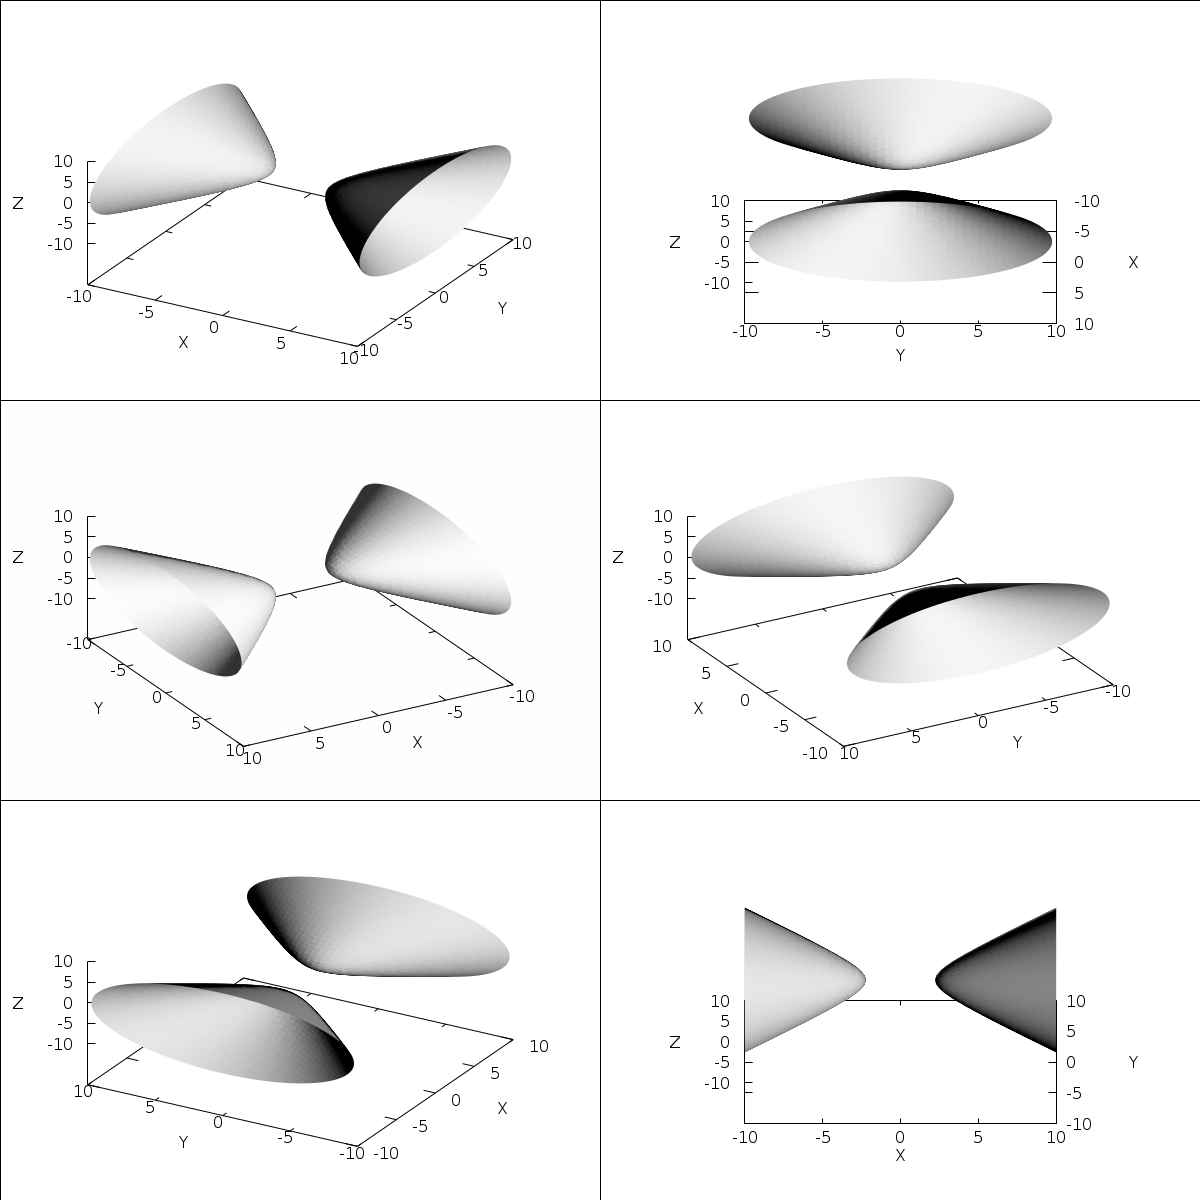
This worksheet provides, what the hyperboloid would
look like, if accurately shaded...
Additionally, a slider-based animation is
being offered.
| (%i3) | F(x, y, z) := x^2 -y^2 -z^2 - 5$ |
| (%i4) |
G(x, y, z) := [ diff(F(x, y, z), x, 1), diff(F(x, y, z), y, 1), diff(F(x, y, z), z, 1) ]$ |
| (%i5) | Gn(x, y, z) := unitvector(G(x, y, z))$ |
| (%i6) |
IsLit(x, y, z, vLight, vView) := signum( (G(x, y, z) . vLight) * (G(x, y, z) . vView) ) * 0.5 + 0.5$ |
| (%i7) |
L(x, y, z, th1, th2) := abs( Gn(x, y, z) . [sin(th1), -cos(th1), 1] ) * IsLit(x, y, z, [sin(th1), -cos(th1), 1], [sin(th2), -cos(th2), 1] )$ |
| (%i8) |
implObj: implicit(F(x, y, z), x, -10, 10, y, -10, 10, z, -10, 10)$ |
| (%i9) | start: elapsed_real_time()$ |
| (%i10) |
with_slider_draw3d( f, [1, 2, 3, 4, 5, 6, 7, 8, 9, 10, 11, 0], x_voxel=40, y_voxel=40, z_voxel=40, enhanced3d=[ L(x, y, z, (f+1)*%pi/6, f*%pi/6) * 0.2 + 0.5, x, y, z ], colorbox=false, palette=gray, view = [45, f*30], implObj )$ |

The number of minutes required to plot sequence:
| (%i11) | (elapsed_real_time() - start) / 60; |
The machine will OOM, unless it has 12GB of RAM!